
It is one of the most chilling, morbid topics around, yet a lot of people have a curious interest in it.
Serial killers grab the news for all of the wrong reasons, but they grab it hard. The country is captivated, either by trials or the pursuit of the individual in question.
Some of these individuals go decades without getting caught, killing hundreds of people in the process.
As such, today’s infographic round-up might be of interest to a few of you. We have scoured the internet and found some of the best infographics that focus on serial killers; whether it is the typical characteristics, or just a visual representation of the terrifying statistics.
There are six in total and each tells a unique, haunting story about the world of serial killers.
The worst serial killers by country
We actually found this first infographic on Twitter, via the AFP. It doesn’t take every country into account, but it perhaps shows how serial killers are far from localized. They operate on a worldwide scale.
For example, over in the UK there is Harold Shipman who is understood to have killer more than 250 murders. Then, if we turn to Colombia, Luis Alfredo Garavito murdered 189 boys under the age of 16.
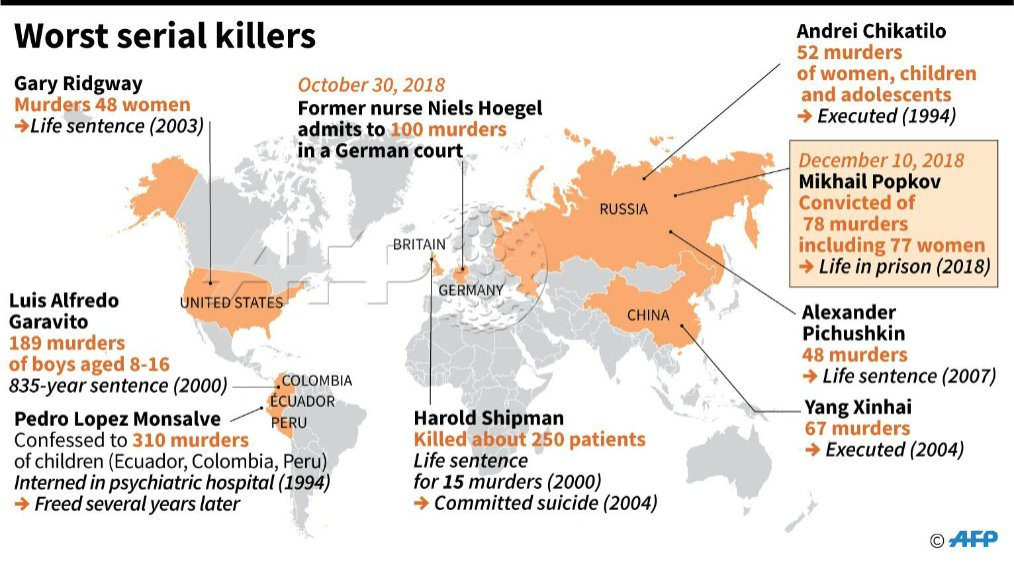
https://twitter.com/AFP/status/1072154923901558784/photo/1
A state-by-state view on serial killers
Following on from the above, let’s now drill down into the United States. This next infographic takes a look at the country at state level, detailing the most prolific serial killer from each one.
It includes everything from Carl Eugene Watts, who is understood to be the most prolific in the country, to those like Robert Leroy Anderson from South Dakota who “only” had two killings to his name.

What makes a serial killer?
This is one of the longer infographics in our list but if you have the time, it’s worth reading through it.
The team at NCC Home Learning have put together a graphic which looks at the true make-up of a serial killer. It looks at the typical motives and perhaps crucially, the early signs that many show before initiating their killing spree. There’s a great deal of science that has been invested in this graphic and it looks at how a lot of serial killers are “developed” following traumatic childhoods.

Not all serial killers are “stereotypical”
Most of us have a fixed opinion of serial killers. They are viewed in a “traditional” sense but in reality, they can be from any walk of life.
This infographic by YourLawyer.com summarizes this point to a tee. It highlights the thousands of deaths caused by medical serial killers; in other words, the doctors and nurses that many of us would never dream of intentionally causing harm.
Quite often these killers relied on overdoses, rather than traditional medical equipment, to kill their victims.

Serial killers by numbers
It appears as though this next infographic was created for the purposes of a college assignment, but it visualizes data to dramatic effect.
It provides a breakdown of various statistics related to serial killers; whether it’s the killing methods, the killer themselves or even the victims.
Perhaps the most damning stat is that 70% of serial killers come from America.
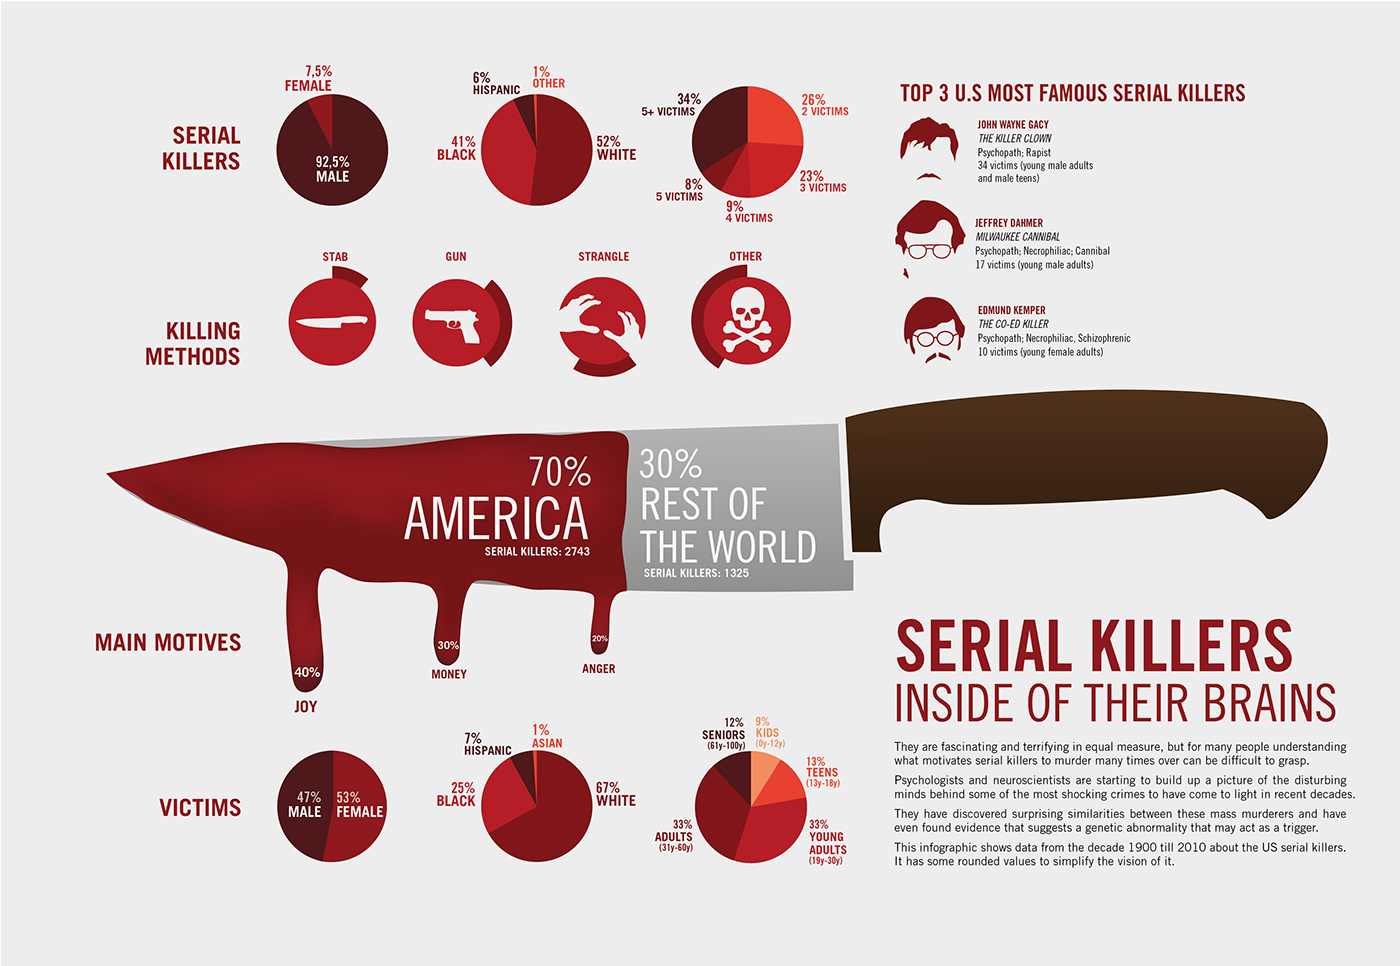
https://www.behance.net/gallery/38345831/Serial-Killers-An-Infographic
The anatomy of a serial killer
We’ll conclude proceedings with a simple infographic, but one that might again provide food for thought. We all have preconceptions about serial killers, but this infographic provides five, basic statistics about the typical “anatomy”.
For example, did you know that over 90% of serial killers are white males?

http://www.infographicsshowcase.com/the-anatomy-of-serial-killer/